
In 2016, the multi-disciplinary journal Nature polled over 1,500 scientists on their thoughts around scientific reproducibility1. The results were astounding. Seventy percent of researches tried and failed to reproduce other scientific work. Furthermore, 50% were unable to reproduce their own research! The cause of irreproducibility is likely due to a number of reasons including inconsistent experimental methodologies and cherry-picking results.
One goal we should strive for as data scientists is to make our work completely reproducible. We should be able to hand over a repository of our analysis and another data scientist should be able to reproduce our results. Reproducibility is important because it demonstrates the validity of our model and results. Furthermore, reproducibility is required when working with a team of analysts, engineers, etc. to deploy a machine learning model or application into production. Using the wrong code or dependencies can cause major headaches when getting to this stage. The following sections will review the core pillars necessary for to do reproducible data science outlined in the graphic below:
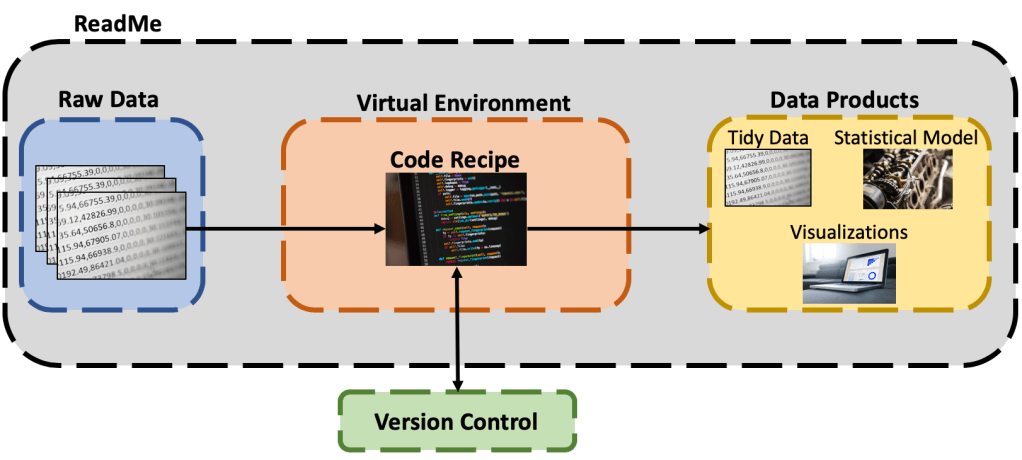
Raw Data
While we may not always be able to control how our data was generated (and the associated bias), we are responsible for keeping a record of the raw data for reference. This is the unedited, unmodified data that comes directly from the data collection process/system. This could be a copy of production data from a database, an unedited Excel file, untouched images, or raw data stream. We must safeguard it as our permanent record of what was actually measured.
Code Recipe
A code recipe is the step-by-step process that transforms our raw data into a data product. A data product is the desired output for the data science task at hand, which may be statistical analysis, a parameterized report, a machine learning model, a tidy data set, etc. Code can be organized in a number of ways, but one common way roughly follows the CRoss-Industry Standard Process for Data Mining (CRISP-DM) lifecycle where each script covers one of the following:
- Data Exploration
- Data Cleaning & Transformation
- Model Construction
- Model Evaluation
- Model Deployment
Early on in a project, I might use a single R-Markdown document or Jupyter notebook to experiment with and explore all of these steps, but later on I’ll split-up my code into individual scripts. The exact code recipe will have some variations from this (for example, some may choose to combine 3 & 4), but the general principle of having task-specific scripts is a good practice.
The last important piece of the code recipe is using version control. As you are prototyping, collaborating with a team, or creating data products, you’ll want to make sure that you consistently track the changes you’ve made to the code base; especially if you plan on stepping away from the project for a while. Doing so will capture your latest code and allow you to come back to where you left off and see what else has changed in the other parts of the code base if other team members have been working. A bonus of using version control is that you can easily restore to previous versions of the code if needed. The most common way to track changes is through the use of git and Github.
The ability to hand off the right version of the code to another data professional is crucial to reproducibility.
Data Products
Data Products are the result of applying the code recipe to the data. The first major data product is tidy data:
Raw Data + Code Recipe = Tidy Data
Tidy data is the clean, transformed, and validated data that every data scientist wished data looked like. It has been thoughtfully inspected with a trained eye, scrubbed clean for missing values and outliers, and feature engineered to provide the extra insight an experienced subject matter expert would have. More information on the principles of tidy data can be found here.
One bonus that I’ve rarely seen in practice, but is still valuable to have, is a data dictionary. A data dictionary contains three key features about the data:
- Variable Name
- Data Type
- Definition/Meaning
Having a data dictionary with the tidy data will get other data professionals up to speed quickly on the data and create a common understanding of what data is being analyzed.
Other data products include data visualizations, parameterized reports, and trained statistical/machine learning models. Including all of these items as part of a data science project allow data professionals to see what the expected results should be and provide a way to validate that they are able to reproduce the analytics output correctly (or at least similarly).
The Data Science Environment
Code needs to be executed somewhere. This somewhere is in the data science environment. This environment includes the version of the programming language interpreter and associated code libraries. The main data science languages, R and Python, usually don’t have all of the functionality readily available to quickly perform data science. This is where libraries come in. A library contains a collection functions and methods that make doing data wrangling, statistics, machine learning, etc. much easier. Over time, these libraries continue to be updated and fixed, resulting in different versions. These versions can have new and deprecated functionality and it’s important to know what version is being used since their output can materially differ.
To capture the version of the programming language and it’s associated dependencies, it’s a best practice to use virtual environment. A virtual environment is a separate standalone programming ecosystem that is isolated from the main distribution of the language. A requirements file can be generated from this environment and used by other data professionals to re-create it on their own computer.
In R, renv is a dependency manager to track and install packages (e.g. libraries) into a project folder that is separate from the main R distribution. In Python, virtualenv along with pip are the defacto standard to create isolated virtual environments. There is also the option to use Anaconda to manage your data science environment in both languages. I have used Anaconda extensively throughout my data science career and find it incredibly easy to use, especially for those not extensively familiar with the command line.
An honorable mention for creating a reproducible data science environment is containerization, which is used to package software in a manner that allows it to by deployed across multiple computing environments. Depending on the complexity of the data science project or the data products (e.g. a SaaS application), use of a containerization software such as Docker may be your best bet at reproducibility.
ReadMe
The final pillar of reproducible data science is the metaphorical “bow on top” – The ReadMe file. This text/markdown file explains the entire content of the data science project and how all of the components described above tie together. It explains the what, how, and results of the data science project:
- What is the goal? What problem are we trying to solve?
- How did we tackle the problem? How do the components in the data science project tie together?
- Results – Were we successful?
The ReadMe file can also include information about how to configure the data science environment, where the raw data came from or how it was generated, or what could be done as a next step in the project.
Wrapping it up…
There are a lot of components to ensuring reproducibility within the data science community. I’ll be the first to admit that I don’t always follow every piece of advice outlined above, but I strive to do a little better each time in my projects. As a result, my work has been easier to manage, maintain, and share with others. Please let me know your thoughts in the comments below. Did I miss anything? How do you practice reproducibility?
And that’s a wrap! I’ll leave you with a little data science reproducibility xkcd humor…

1 Nature Video (28 May 2016). “Is There a Reproducibility Crisis in Science?”. Scientific American. Retrieved 13 May 2020.
