
TLDR; you can check out my end-to-end machine learning code (including model deployment) here. All feedback welcome!
Introduction
I’ve spent the last few weeks exploring the Google Cloud Platform and it’s role in the CRoss-Industry Standard Process for Data Mining (CRISP-DM) lifecycle.

Based on my experience, most data scientists (including myself) have experience all the way through the Evaluation phase of a data science project. But when the time comes to move a model from being a desktop widget to a deployed model live in production, the metaphorical wheels come off. Of course, not every model needs to or should be put into production. But there are times in which deployment is critical to drive business value, especially when powering various web based processes or applications.
Over the last few years, the various cloud providers have developed services to assist data scientists with this significant, albeit neglected, task. With the significant innovation coming out of Google in the field of machine learning and data science (TensorFlow, anyone?), I wanted to see what type of technologies they were creating for data scientists to deploy models. Enter the AI Platform.
The AI Platform
So, what exactly is the AI Platform? Let’s look to Google to tell us in their own words:
[The] AI Platform makes it easy for machine learning developers, data scientists, and data engineers to take their ML projects from ideation to production and deployment, quickly and cost-effectively.
– AI Platform Documentation
Basically, the AI Platform consists of several services meant to complement other Google Cloud Platform (GCP) services to provide an end-to-end solution for machine learning projects. I’ve worked with a few of their services including Cloud Storage, Big Query, AI Platform Notebooks, and AI Platform Prediction; all of which were fairly intuitive to use. However, for the purposes of model deployment, I focused my efforts on using AI Platform Prediction:

The AI Platform Prediction service provides a “serverless” deployment mechanism for Python-based machine learning models. This is extremely convenient for a data scientist; there is no compute instance that needs to be managed or configured, GCP takes care of that for you. Instead, there are a set of container images from which to choose that specify how, at a high-level, the server/data science environment is configured.
A deployed model only incurs cost when a node is in a ready state or performing predictions. A ready state occurs in the first few minutes after a prediction request is issued to the Platform, just in case more requests come through. After a few minutes, the node spins back down. Costs are rounded to the nearest 30 seconds or minute, depending on the type of resource used. More information about prediction costs can be found here.
There are a few different ways to deploy a machine learning model using their prediction service. For example, there is the ability to deploy a simple scikit-learn pipeline, in which only a pickled pipeline is saved in a Cloud Storage Bucket and called on to make predictions. However, for more complex machine learning tasks, a scikit-learn pipeline will be insufficient to capture all of the data pre-processing and prediction steps required. In order to do this, the Google Cloud currently has a beta edition of what is called a custom prediction routine, which is what I set out to deploy.
Building an End-to-End Heart Disease Classification Project
In order to improve my understanding of the model deployment process, I created a true end-to-end machine learning project that starts with raw data from the UCI Machine Learning Repository and ends with a custom prediction routine deployed using the AI Platform. I intentionally chose a data set that had missing values and poorly encoded features to really test my and the AI Platform’s capabilities. For example, some of the categorical features were encoded as integers and the classification target feature was an integer ranging from 0-4, where any value greater than 0 was considered an indicator of heart disease.
I won’t spend time discussing the details of the actual data or code in this blog since it’s well documented in the README and associated Jupyter notebooks on Github. Instead, I’ll talk about the major challenges and decisions made as I went through its development.
Main Challenges & Decisions
The main challenges roughly break down into four categories:
- Sharing environment requirements
- Data
- Modeling
- Deployment
Sharing Environment Requirements
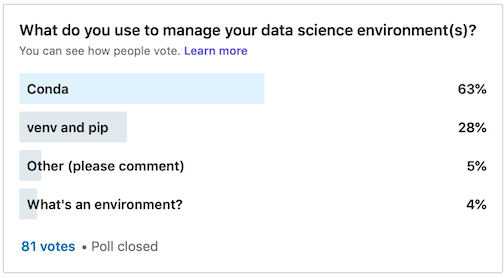
There are two main ways to share Python-based data science environments with other data professionals – either using Conda or venv/pip. Both methods have their advantages and disadvantages. Based on my own anecdotal survey on LinkedIn, Conda is more popular than venv by a ratio of 2:1
Conda is also both a package and environment manager, which is handy. However, the biggest drawback is that its environment/requirements file is not always compatible with venv. I’ve seen some weird stuff in a Conda requirements file. However, a requirements file created from a venv/pip environment is fully compatible with a conda environment. This was the biggest determining factor in my decision to use venv/pip to distribute project requirements.
Data
The raw data had a lot of strange artifacts as explained above. On top of that, the Kaggle data that is stated to be a copy of the UCI data has significant differences. I spent a good amount of time upfront in this project really understanding the features provided, their interpretation, and how to do proper feature engineering.
Modeling
I encountered the main questions most data scientists face when thinking through the modeling phase.
Which models should I use?
When have I tuned my models enough?
What metric should I use to assess model performance?
Ultimately I settled on a set of four classifiers of increasing complexity, starting with logistic regression and k-nearest neighbors, and ending with XGBoost. For all of these models I used a set of reasonable hyper-parameter spaces based on experience or other empirical evidence. Since my data set was so small, all of my models had similar accuracy metrics. The best model performance metric to choose is determined by the class (im)balance in a data set and the “severity” of false positive and negatives. My data set was fairly balanced and I considered both false positive and negatives to have equal weighting, so I ultimately used accuracy. There is certainly an argument that a false positive is worse to have than a false negative when trying to determine heart disease, in which recall is more important. When doing modeling, I usually look at many metrics, including the model’s recall and create an interactive precision-recall plot to explore this issue further:

Deployment
Model deployment was definitely the biggest learning curve working on this project. Initially I set out to deploy a simple scikit-learn pipeline. But the data required some initial pre-processing that wasn’t easily incorporated into a pipeline operator. Sure, I could pre-process the data first before training and sending to the model for prediction, but I wanted the ability to pass a completely raw observation to the model and have it handle everything. I also wanted the challenge of learning how to deploy a more complex model. This required a custom prediction routine, which is significantly more complex than just deploying a simple pickled pipeline. Custom preprocessor and predictor classes must be created and bundled into a source distribution. Even after the model was deployed, it took several hours of trial and error to understand why I kept receiving the ominous message:
"Prediction failed: unknown error."
Debugging can be a real headache when there isn’t a traceback. There are ways to set-up logging but I was able to figure out my bugs before trying to dig through prediction logs. Lessons learned?
- Pay attention to the input format of a prediction request
- Make sure your local data science environment matches the container image specifications available in the AI Platform.
Next Steps
There is one more extension that I would like to make to this project. A model has been deployed, but I would like to build a simple web application using something like streamlit to allow an end user to “turn the dials” of the input features and explore how that changes the probability of heart disease.
If you have experience with model deployment, I’d love to hear your insights!
