

Note: This blog post is for Udacity’s Data Scientist Nanodegree Program.
Introduction
There are two main challenges when running a subscription-based business: getting customers and retaining them. The goal of this project was to analyze customer churn data for an online Software as a Service (SaaS) company to understand how attributes about the customer’s enrollment impacted their subscription duration. The three attributes tracked for each customer include their subscription tier (e.g. Silver, Gold, or Platinum), how they were sourced (e.g. through partnerships, referrals, or organically), and their country. The snapshot below shows the data for the first few customers.

Nearly 100,000 newly enrolled customers were tracked over an eight month period. The business is interested in knowing:
- What was the churn rate over the first 8 months of enrollment for each price tier?
- What was the average tenure for each price tier?
- What impact does the tier, country, and source of a customer have on their tenure and risk of customer churn?
- How many currently active subscriptions will still be active over the next three months (e.g. month 9, 10, 11)?
The technical details (including more in-depth analysis) can be found in the associated Github repository.
What was the churn rate over the first 8 months of enrollment for each price tier?
The Silver tier had the lowest overall churn rate by over 10% compared to the other two plan tiers.

- The Gold tier had churn rate of 96% after 8 months.
- The Platinum tier had a churn rate of 99% after 8 months.
- The Silver tier had a churn rate of 82% after 8 months.
What was the average tenure for each price tier?
Due to a lower churn rate shown above, the Silver tier had a longer average tenure by nearly a month and a half compared to the other two tiers.

What impact does the tier, country, and source of a customer have on their tenure and risk of customer churn?
A survival regression model was used to estimate a customer’s probability of “surviving” each month; which in this context is the probability of continued enrollment in their SaaS subscription. The model also lends itself to reasonably interpretable coefficients and can be used to understand the impact of a customer’s enrollment characteristics on their tenure. The impact of a customer’s enrollment attributes are measured relative to the baseline attributes in the model and their associated mean/median survival times. The baseline attributes in the model are based on a Canadian customer in the Gold tier with an organically sourced enrollment. Their median survival time was 1.65 months and the mean survival time was 2.0 months.
Tier
Customers in the Platinum tier have a 28% lower median/mean enrollment time, whereas customers in the Silver tier have a 97% longer mean/median enrollment time. The plot below shows how the customer tier directly impacts tenure, accounting for the other covariates.

Country
All countries have the same or lower tenure except for the Netherlands, which has a 7% longer mean/median enrollment. Spain has the lowest tenure, which is 22% lower than the mean/median baseline enrollment. The UK, US, and Germany have similar tenure as those from Canada. The plot below shows the impact of some of the countries on tenure, accounting for the other covariates.

Source
Customers sourced from both referrals and partnerships had significantly longer enrollment periods compared to those that enrolled organically. Referrals had a 172% longer mean/median enrollment, whereas partnership customers had enrollments that were 60% longer. The plot below shows how the customer source impacts the probability of survival, accounting for the other covariates.

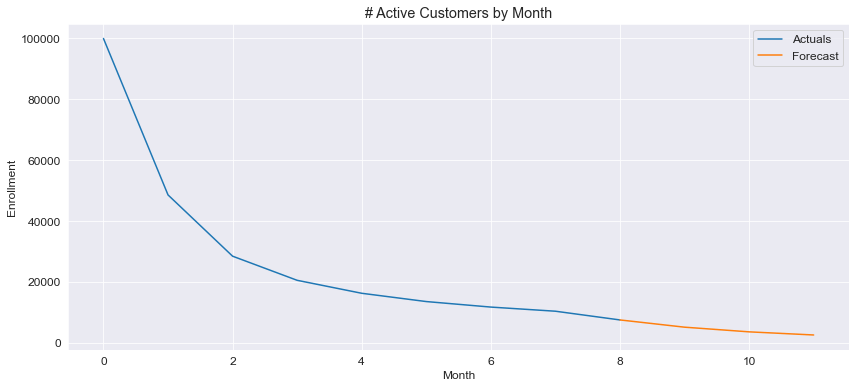
How many currently active subscriptions will still be active over the next three months (e.g. month 9, 10, 11)?
The Weibull-based parametric survival model was used to forecast the expected enrollment for the next three months for all active customers. The total number of active customers drops from 7,492 after the first 8 months to 2,552 three months later. Below are the estimates and a plot showing the trend.
| Month | Active Customers |
| 9 | 5,114 |
| 10 | 3,578 |
| 11 | 2,552 |
Final Thoughts
Predicting churn rates beyond 9 months had highly variable results, depending on the model and selected hyperparameters. While the analysis above does provide estimates for months 9, 10, and 11, these estimates should be considered rough guides. As more data is collected in the coming months, the models should be re-run and calibrated to the actual churn results.
